
Record live data
Poll the signals you need, watch them on a graph and export the selection when the test is done.
Steps
- Open ECU Edit → Measurement Values for the selected ECU.
- Tick parameters in the list. The header checkbox toggles all of them.
- Set Update period (ms) — 100 to 10,000 ms.
- Press Start. With an empty list nothing happens.
- Switch between Table, Graph → Combined (normalized) and Graph → Separate.
- Press Stop when the test ends.
- Press Save to CSV to export.
While the measurement runs, the checkboxes, period and buffer length are locked.
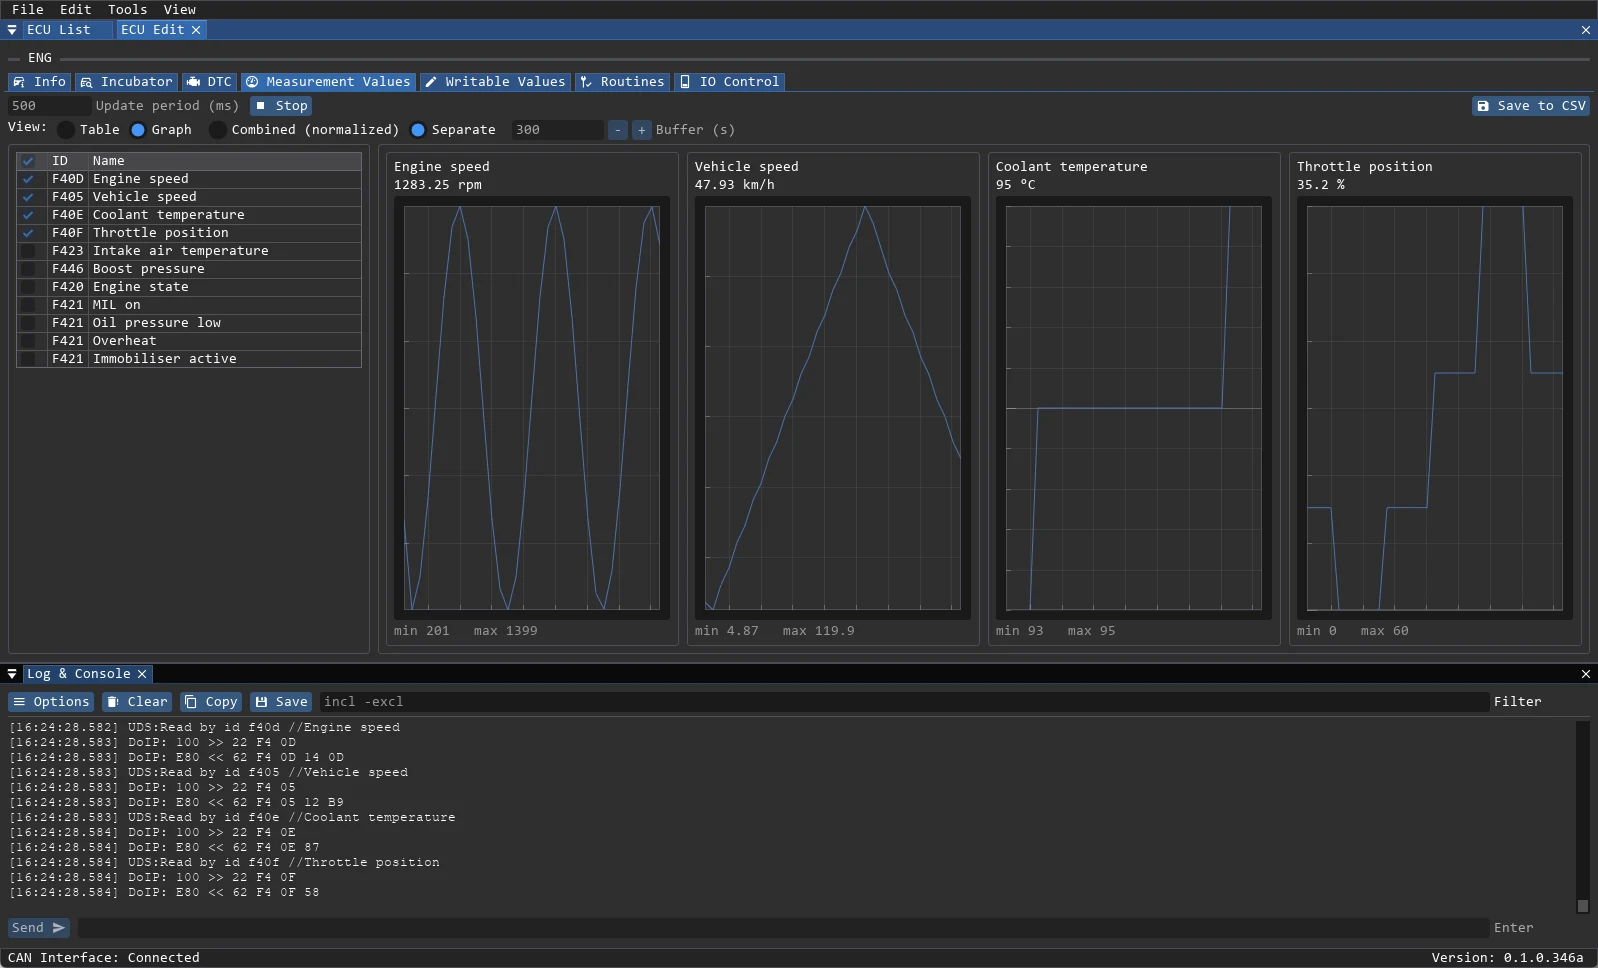
Graph modes
- Combined (normalized) — one plot; each series is normalized to 0–100% of its own min/max. The legend shows name, DID, value and unit.
- Separate — one auto-scaled card per parameter, filling the available area.
- Only
uintandintcan be plotted.ascii,hex,enumandcombinedshowNot graphable. No datameans the value has not been read;No samplesmeans no history has accumulated yet.
Buffer
Buffer (s) is the history length per series, 1–3600 seconds, default 300. It is visible only in Graph mode and applies on the next Start; the value is stored globally. The history is cleared when the ECU or the view selection changes.
Link loss
A short interruption retries the read instead of ending the task. After a longer series of errors the measurement stops. Check the log, reconnect, then press Start again.
CSV
Save to CSV writes the selected parameters, one per line, with no header:
"Name","DID","Value Unit"The measurement CSV has no timestamps; it is a snapshot of the selected values. Use the log if you need the request timing.